PronSci charts for English
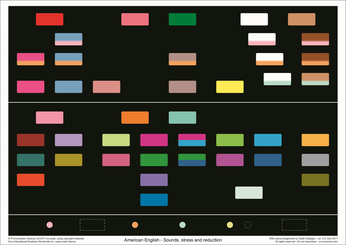
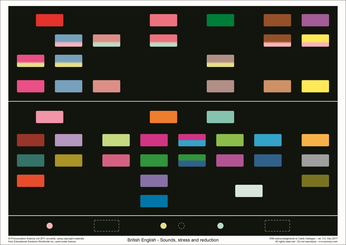
There are PronSci charts for both British and American English. Each set is made up of a Rectangle chart, a two-part Spelling chart (also known as a Fidel), and 16 Word charts. The charts are shown in full below.
Note that these charts are teaching tools rather than reference materials; the teacher uses them to make students aware of all the facets of the language, large and small, and to help them to practise using new language until it is internalised.
There are supporting guides for new users of the charts, and information about chart sizes and prices. For ordering information, see here.
The PronSci Rectangle chart is organised along articulatory lines. Each coloured rectangle represents a sound of English. (The key to the layouts can be found on the support page.)
In the arrangement of the sounds on the charts:
- The vowels, as well as the consonants, are organised by the movements needed to produce them.
- The vowels are presented as either high or low energy, at the top and bottom of the chart respectively. This clearly differentiates the 'normal' vowels from schwa and the other reduced vowels.
- The consonants, in the middle section, are arranged by place and manner of production as conventionally done. But their grouping also reflects the distinctive articulatory setting of English.
There is a more detailed explanation of the arrangements on the support page.
The Spelling chart (Fidel) shows the complete relationship between sounds and spelling in English. Its overall organisation is the same as that of the rectangle chart, so sounds appear in the same colour and in the same location on each.
One of the advantages of using colour for sounds rather than using IPA symbols, is that words can be written normally, but with their pronunciation apparent at the same time.
Any word in English (except for unusual proper names) can be spelled out using the groups of letters on the Fidel, with the word's correct pronunciation indicated by the colours chosen. Letters and letter combinations that are part of the underlying spelling system are printed in a larger size than those that are needed for just a few words.
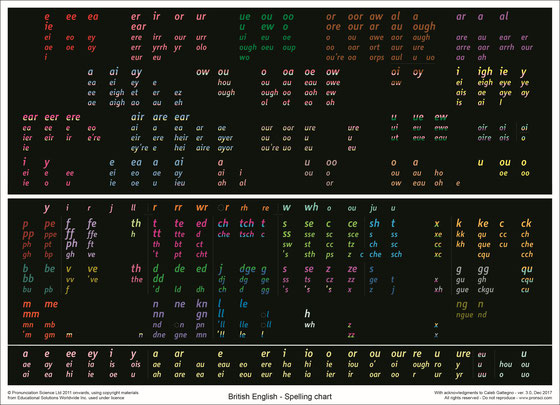
A full key is provided with the Fidel, with example words for each spelling and information about phonetic symbols etc.
The Guide to the Spelling charts (also available via the Support page) describes the principles behind the design.
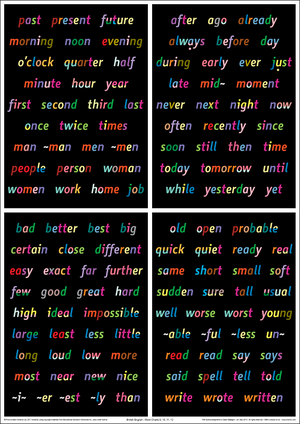
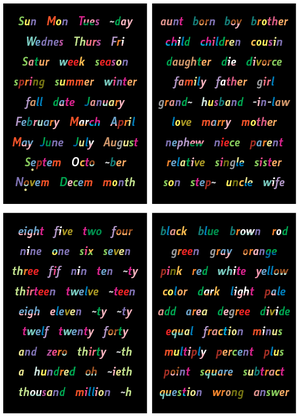
The sixteen Word Charts contain the functional vocabulary of English organised by parts of speech. The charts use the same colours as the Rectangle chart and the Spelling chart to indicate the pronunciation of words. The strong and weak forms of those words which have two pronunciations are shown by the dots beneath them.
As well as individual words, whole sentences can be pointed out. This enables students to work on the production of natural speech without having to follow a teacher’s model.
The charts above are themed:
| # 1 |
Pronouns and demonstratives |
||
| # 2 | Articles, question words and function words | ||
| # 3 - 4 | More function words (in alphabetical order) | ||
| # 5 | Verb auxiliaries | ||
| # 6 - 8 | Common verbs and verb endings | ||
| # 8 | lines 8 & 9: gonna, wanna, haf to, etc |
The themes for the charts above:
| # 9 | Time, order and pronunciation irregularities | |
| # 10 | Time triggers | |
| # 11 | Adjectives and comparisons | |
| # 12 | More adjectives, affixes and classroom verbs |
The themes for the charts above:
|
# 13 |
Dates | |
| # 14 | Family relations | |
| # 15 | Numbers | |
| # 16 | Colours and mathematics |
The Guide to the Word charts (also available via the Support page) describes the principles behind the design.
Click here for information about chart sizes and prices.
The gallery below shows detail from the charts and the guides which are supplied with all sets. Single click on a picture to enlarge it, or to start a slideshow.
We are grateful to Don Cherry for his assistance in the design of the American English charts.
 Pronunciation Science
